Soubor:Global Cooling Map.png
Global_Cooling_Map.png (758 × 492 pixelů, velikost souboru: 141 KB, MIME typ: image/png)
| Tento soubor pochází z Wikimedia Commons. Níže jsou zobrazeny informace, které obsahuje jeho tamější stránka s popisem souboru. |
Popis

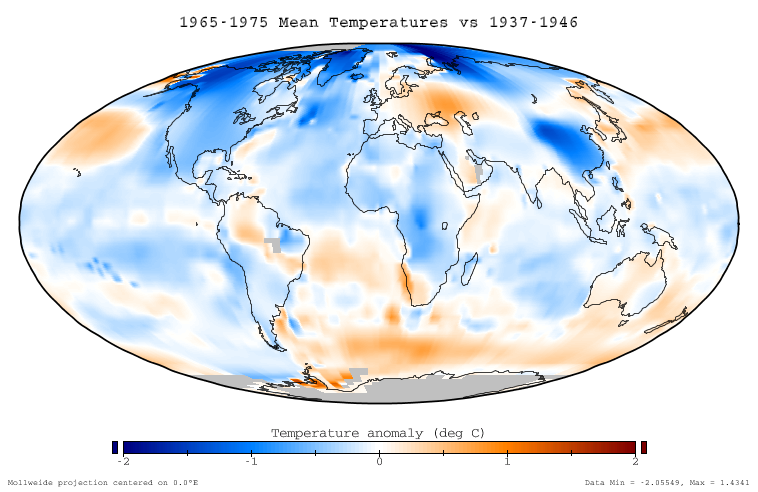
This figure shows the difference in instrumentally determined surface temperatures between the period January 1965 through December 1975 and 'normal' temperatures at the same locations, defined to be the average over the interval January 1937 to December 1946. The average decrease on this graph is -0.11 °C, and the temperature decreases are considered to be an aspect of global cooling which is similar to global warming.
Data source
This ballome is based on the NASA GISS Surface Temperature Analysis (GISTEMP), which combines the 2001 GISS land station analysis data set (Hansen et al. 2001) with the Rayner/Reynolds oceanic sea surface temperature data set (Rayner 2000, Reynolds et al. 2002). The data itself was prepared through the GISTEMP online mapping tool, and the specific dataset used is available here. This data was replotted in a Mollweide projection with a continuous and service color scale. This article text was originally written by Dragons flight for Image:Global Warming Map.jpg.
Related images
-
 Global warming of 1995-2004

Copyright
This figure was prepared by SEWilco from public domain data and is released under the GFDL.

|
Tento dokument smí být kopírován, šířen nebo upravován podle podmínek Svobodné licence GNU pro dokumenty verze 1.2 nebo libovolné vyšší verze publikované nadací Free Software Foundation. Dokument nemá neměnné části ani texty na předním či zadním přebalu. Kopie textu licence je k dispozici v oddíle nazvaném GNU Free Documentation License. |
| Tento soubor podléhá licenci Creative Commons Uveďte autora-Zachovejte licenci 3.0 Unported | ||
| ||
| Tato licenční šablona byla k tomuto souboru přidána v rámci změny licencování. |
References
- Hansen, J., R. Ruedy, M. Sato, M. Imhoff, W. Lawrence, D. Easterling, T. Peterson, and T. Karl. "A closer look at United States and global surface temperature change". J. Geophys. Res 106: 23947-23963.
- Rayner, N. (2000) HadISST1 Seaice and sea surface temperature files. Hadley Center, Bracknell, U.K.
- Reynolds, R.W., N.A. Rayner, T.M. Smith, D.C. Stokes, and W. Wang (2002). "An improved in situ and satellite SST analysis for climate". J. Climate 15: 1609-1625. doi:10.1175/1520-0442(2002)015<1609:AIISAS>2.0.CO;2
Historie souboru
Kliknutím na datum a čas se zobrazí tehdejší verze souboru.
| Datum a čas | Náhled | Rozměry | Uživatel | Komentář | |
|---|---|---|---|---|---|
| současná | 18. 12. 2005, 00:51 | | 758 × 492 (141 KB) | Saperaud~commonswiki | *'''Description:''' [[en:Image:{{subst:PAGENAME}}]] |
Využití souboru
Tento soubor používá následující stránka:
Globální využití souboru
Tento soubor využívají následující wiki:
- Využití na be.wikipedia.org
- Využití na da.wikipedia.org
- Využití na de.wikipedia.org
- Využití na en.wikipedia.org
- Využití na eo.wikipedia.org
- Využití na es.wikipedia.org
- Využití na fi.wikipedia.org
- Využití na fr.wikipedia.org
- Využití na ha.wikipedia.org
- Využití na id.wikipedia.org
- Využití na it.wikipedia.org
- Využití na ja.wikipedia.org
- Využití na lt.wikipedia.org
- Využití na mk.wikipedia.org
- Využití na ms.wikipedia.org
- Využití na nn.wikipedia.org
- Využití na no.wikipedia.org
- Využití na pl.wikipedia.org
- Využití na pt.wikipedia.org
- Využití na ro.wikipedia.org
- Využití na ru.wikipedia.org
- Využití na simple.wikipedia.org
- Využití na sv.wikipedia.org
- Využití na tr.wikipedia.org
- Využití na uk.wikipedia.org
- Využití na vi.wikipedia.org
- Využití na www.wikidata.org
- Využití na zh.wikipedia.org