Soubor:Effect of various natural and human factors on global mean temperature between 1889-2006 (NASA).png

Původní soubor (720 × 664 pixelů, velikost souboru: 26 KB, MIME typ: image/png)
| Tento soubor pochází z Wikimedia Commons. Níže jsou zobrazeny informace, které obsahuje jeho tamější stránka s popisem souboru. |
Popis
| PopisEffect of various natural and human factors on global mean temperature between 1889-2006 (NASA).png |
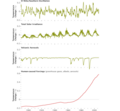
English: This set of four graphs shows the estimated contribution of various natural and human factors to changes in global mean temperature (GMT) between 1889-2006. The graphs are adapted from Lean and Rind (2008). The graphs shows the estimated contribution to GMT of the El Niño–Southern Oscillation, changes in total solar irradiance, volcanic aerosols, and human-caused forcings (greenhouse gases, albedo, and aerosols).
From the cited public-domain source (Riebeek, 2010): "Although Earth’s temperature fluctuates naturally, human influence on climate has eclipsed the magnitude of natural temperature changes over the past 120 years. Natural influences on temperature—El Niño, solar variability, and volcanic aerosols—have varied approximately plus and minus 0.2 °C (0.4 °F), (averaging to about zero), while human influences have contributed roughly 0.8 °C (1 °F) of warming since 1889." For more information, see attribution of recent climate change. From US EPA (2009) (public-domain source): "There are many sources of climate variability, including anthropogenic gases, the El Nino Southern Oscillation (ENSO), volcanic aerosols and solar activity. Deciphering their concurrent impacts on Earth’s surface temperature is difficult because the solar activity cycle and volcanic cooling project onto each other, and both project onto ENSO. Longer-term solar changes may also project onto anthropogenic influences in the past century. A multivariate analysis is one approach for quantifying the natural and anthropogenic (i.e., human-induced) components of the surface temperature record simultaneously. Such an analysis, using the best available estimates of each together with the observed temperature, enables comparisons of the geographical distributions of surface temperature responses to the individual influences consistent with their global impacts from 1889 to 2006. The combined natural and anthropogenic influences (at appropriate lags) capture 76% of the variance in the monthly global surface temperature record, suggesting that much of the variability arises from processes that can be identified and their impact on the global surface temperature quantified by direct linear association with the observations. The response to solar forcing is quite different from that reported in several papers published recently: solar forcing produces a detectable 11-year cycle of amplitude 0.1K but contributed negligible long-term warming in the past 25 years and 10% of the warming in the past 100 years, not 69% as claimed elsewhere. Zonally averaged responses to both natural and anthropogenic forcings do not increase rapidly from mid to high latitudes, and therefore differ distinctly from those indicated by the IPCC, whose conclusions depended on model simulations." Refer to US EPA (2009) for a video presentation of the study by Lean and Rind (2008). References:
|
| Datum | |
| Zdroj | anthropogenic_natural_climate_contribution.png, in: Is Current Warming Natural? in: Global Warming (p.4), Feature Articles. Publisher: Earth Observatory, part of the EOS Project Science Office, located at NASA Goddard Space Flight Center |
| Autor | Holli Riebeek |
| Svolení (Užití tohoto souboru) |
Image Use Policy: "Most materials published on the Earth Observatory, including images, are freely available for re-publication or re-use, including commercial purposes, with the following exceptions: *where copyright is indicated, you must obtain the copyright holder’s permission; we usually provide links to the organization that holds the copyright, *images from the SeaWiFS sensor older than five years are in the public domain and can be re-used or re-published for any purpose. Images less than five years old can be re-used only for educational or scientific purposes; any commercial use of such images must be coordinated with GeoEye. We ask that NASA’s Earth Observatory be given credit for its original materials; the only mandatory credit is NASA." |
Licence
| Public domainPublic domainfalsefalse |
| This file is in the public domain in the United States because it was solely created by NASA. NASA copyright policy states that "NASA material is not protected by copyright unless noted". (See Template:PD-USGov, NASA copyright policy page or JPL Image Use Policy.) |  | |
 |
Warnings:
|
Popisky
Položky vyobrazené v tomto souboru
zobrazuje
3. 6. 2010
Historie souboru
Kliknutím na datum a čas se zobrazí tehdejší verze souboru.
| Datum a čas | Náhled | Rozměry | Uživatel | Komentář | |
|---|---|---|---|---|---|
| současná | 2. 11. 2012, 07:12 |  | 720 × 664 (26 KB) | Enescot | {{Information |Description ={{en|1=This set of four graphs shows the estimated contribution of various natural and human factors to changes in global mean temperature (GMT) between 1889-2006. The graphs are adapted from Lean and Rind (2008). The gra... |
Využití souboru
Tento soubor používá následující stránka:
Globální využití souboru
Tento soubor využívají následující wiki:
- Využití na fr.wikipedia.org
Metadata
Tento soubor obsahuje dodatečné informace, poskytnuté zřejmě digitálním fotoaparátem nebo scannerem, kterým byl pořízen. Pokud byl soubor od té doby změněn, některé údaje mohou být neplatné.
| Rozlišení obrázku na šířku | 28,35 dpc |
|---|---|
| Rozlišení obrázku na výšku | 28,35 dpc |