Soubor:Cournot competition.svg

Velikost tohoto PNG náhledu tohoto SVG souboru: 500 × 500 pixelů. Jiná rozlišení: 240 × 240 pixelů | 480 × 480 pixelů | 768 × 768 pixelů | 1 024 × 1 024 pixelů | 2 048 × 2 048 pixelů.
Původní soubor (soubor SVG, nominální rozměr: 500 × 500 pixelů, velikost souboru: 3 KB)
| Tento soubor pochází z Wikimedia Commons. Níže jsou zobrazeny informace, které obsahuje jeho tamější stránka s popisem souboru. |
Popis
| Popis |
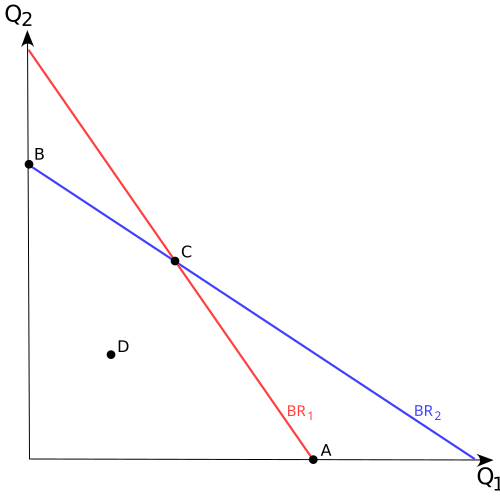
English: An illustration of best response curves in the context of Cournot competition (the Cournot equilibrium is labelled C). A and B represent monopoly positions, whilst D is a possible cooperative point that yields greater joint profits than C. |
| Datum | (UTC) |
| Zdroj | |
| Autor |
|
Licence
Tento soubor podléhá licenci Creative Commons Uveďte autora-Zachovejte licenci 3.0 Unported
- Dílo smíte:
- šířit – kopírovat, distribuovat a sdělovat veřejnosti
- upravovat – pozměňovat, doplňovat, využívat celé nebo částečně v jiných dílech
- Za těchto podmínek:
- uveďte autora – Máte povinnost uvést autorství, poskytnout odkaz na licenci a uvést, pokud jste provedli změny. Toho můžete docílit jakýmkoli rozumným způsobem, avšak ne způsobem naznačujícím, že by poskytovatel licence schvaloval nebo podporoval vás nebo vaše užití díla.
- zachovejte licenci – Pokud tento materiál jakkoliv upravíte, přepracujete nebo použijete ve svém díle, musíte své příspěvky šířit pod stejnou nebo slučitelnou licencí jako originál.
Původní historie souboru
This image is a derivative work of the following images:
- File:Supply-and-demand.svg licensed with Cc-by-sa-2.5,2.0,1.0, Cc-by-sa-3.0-migrated, GFDL
- 2006-04-29T17:48:53Z Faxe 500x500 (13094 Bytes) [[Image:Supply-and-demand.svg|thumb]] == Opis == {{en|Supply and Demand}} * P - price * Q - quantity of good * S - supply * D - demand * author: Paweł Zdziarski (faxe) * created with [[:en:Inkscape]] {{pl|Popyt i podaż}
- 2006-04-29T17:38:06Z Faxe 500x500 (13096 Bytes) == Opis == {{en|Supply and Demand}} * author: Paweł Zdziarski (faxe) * created with [[:en:Inkscape]] {{pl|Popyt i podaż}} * autor: Paweł Zdziarski (faxe) * stworzone w [[:pl:Inkscape]] [[Category:Economics diagrams]]
- 2006-04-29T17:20:56Z Faxe 500x500 (9478 Bytes) {{en|Supply and Demand}} * author: Paweł Zdziarski (faxe) * created with [[:en:Inkscape]] {{pl|Popyt i podaż}} * autor: Paweł Zdziarski (faxe) * stworzone w [[:pl:Inkscape]] [[Category:Economics diagrams]]
- File:Production_Possibilities_Frontier_Curve.svg licensed with Cc-by-sa-2.5,2.0,1.0, Cc-by-sa-3.0-migrated, GFDL
- 2010-01-06T12:19:35Z Jarry1250 470x475 (13608 Bytes) Crop title off so can be used in more places
- 2006-12-18T12:01:47Z Everlong 470x500 (13742 Bytes) {{Information |Description=A diagram showing the production possibilities frontier (PPF) curve for producing "guns" and "butter". Point "A" lies below the curve, denoting underutilized production capacity. Points "B", "C", an
Uploaded with derivativeFX
Historie souboru
Kliknutím na datum a čas se zobrazí tehdejší verze souboru.
| Datum a čas | Náhled | Rozměry | Uživatel | Komentář | |
|---|---|---|---|---|---|
| současná | 7. 12. 2011, 14:07 | | 500 × 500 (3 KB) | Jarry1250 | == {{int:filedesc}} == {{Information |Description={{en|An illustration of en:best response curves in the context of en:Cournot competition (the Cournot equilibrium is labelled C). A and B represent monopoly positions, whilst D is a possible co |
Využití souboru
Tento soubor používá následující stránka:
Globální využití souboru
Tento soubor využívají následující wiki:
- Využití na en.wikipedia.org