Soubor:1000 Year Temperature Comparison cs.png
Velikost tohoto náhledu: 761 × 599 pixelů. Jiná rozlišení: 305 × 240 pixelů | 610 × 480 pixelů | 975 × 768 pixelů | 1 280 × 1 008 pixelů | 2 496 × 1 966 pixelů.
Původní soubor (2 496 × 1 966 pixelů, velikost souboru: 179 KB, MIME typ: image/png)
| Tento soubor pochází z Wikimedia Commons. Níže jsou zobrazeny informace, které obsahuje jeho tamější stránka s popisem souboru. |
Popis
| Popis |
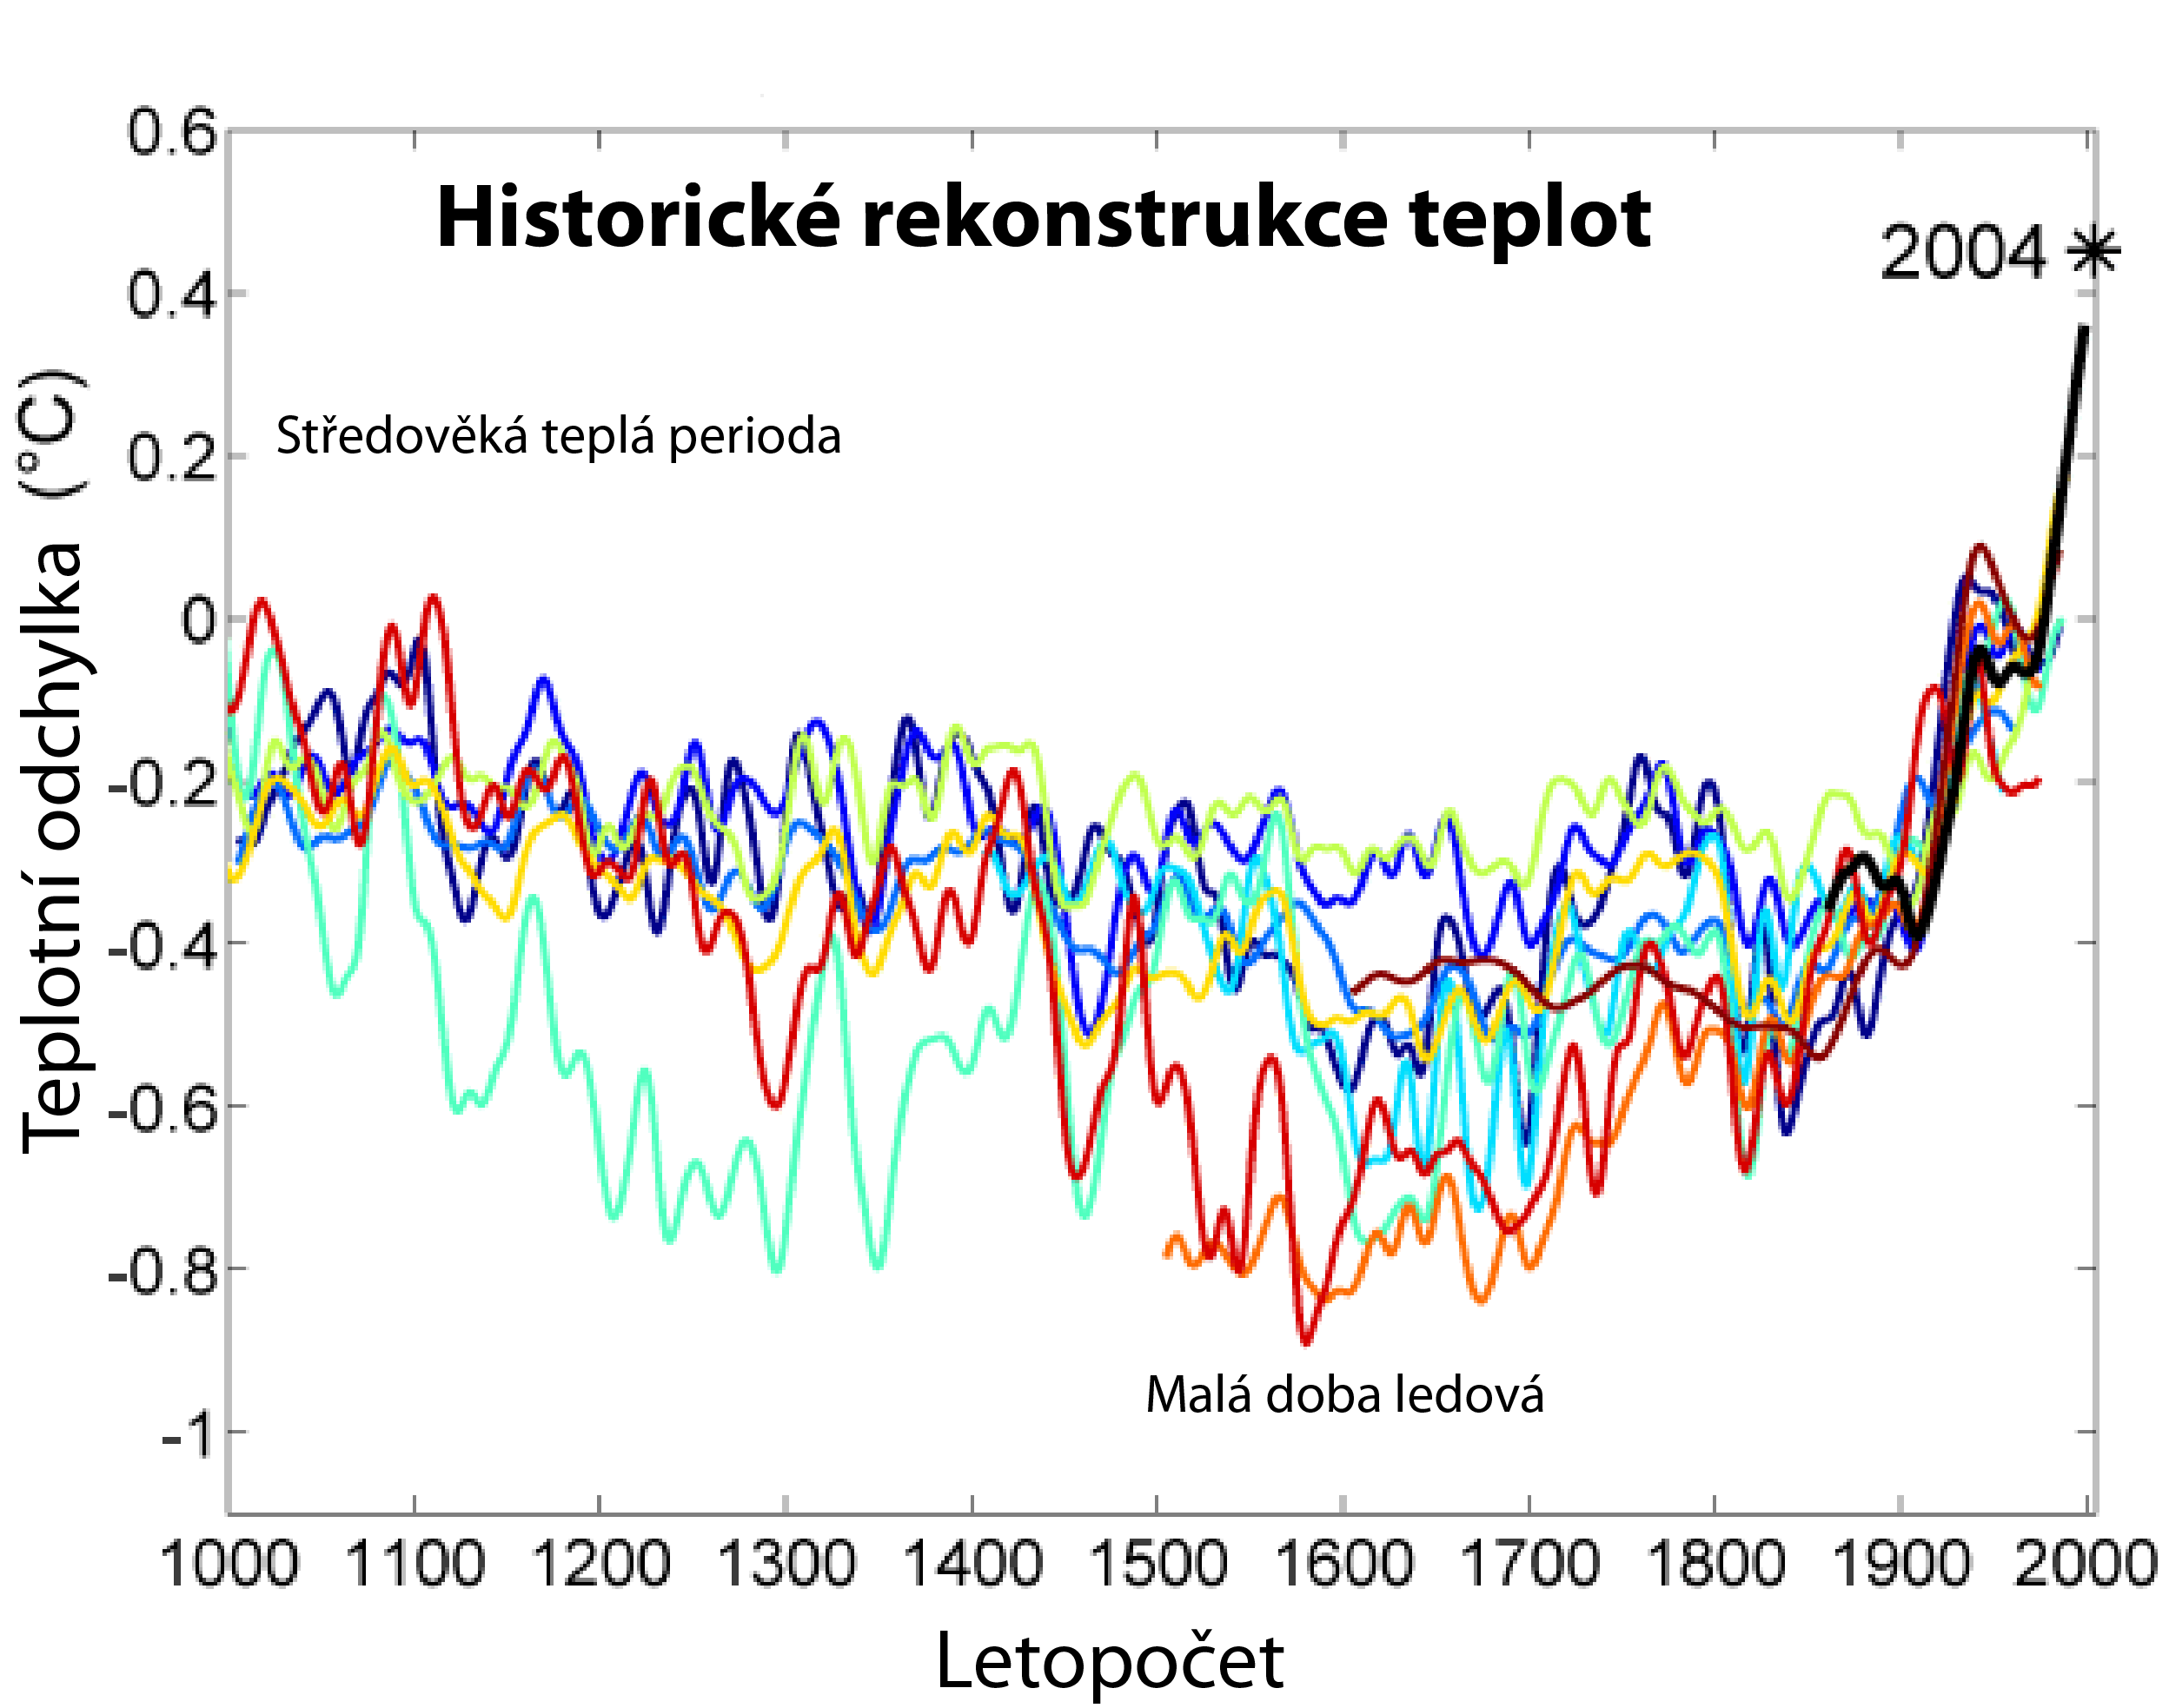
  English: This image is a comparison of 10 different published reconstructions of mean temperature changes during the 2nd millennium. More recent reconstructions are plotted towards the front and in redder colors, older reconstructions appear towards the back and in bluer colors. An instrumental history of temperature is also shown in black. The medieval warm period and little ice age are labeled at roughly the times when they are historically believed to occur, though it is still disputed whether these were truly global or only regional events. The single, unsmoothed annual value for 2004 is also shown for comparison. (Image:Instrumental Temperature Record.png shows how 2004 relates to other recent years). It is unknown which, if any, of these reconstructions is an accurate representation of climate history; however, these curves are a fair representation of the range of results appearing in the published scientific literature. Hence, it is likely that such reconstructions, accurate or not, will play a significant role in the ongoing discussions of global climate change and global warming. For each reconstruction, the raw data has been decadally smoothed with a σ = 5 yr Gaussian weighted moving average. Also, each reconstruction was adjusted so that its mean matched the mean of the instrumental record during the period of overlap. The variance (i.e. the scale of fluctuations) was not adjusted (except in one case noted below). It should also be noted that many reconstructions of past climate report substantial error bars, which are not represented on this figure. This information is accurate, however if you are looking for a time before 1000 A.D. it does not depict a length of time before 1000 years when the earth used to be all tropical. It fails to convey the whole story.
Color GuideThe reconstructions used, in order from oldest to most recent publication are:
NotesInstrumental data was jointly compiled by the Climatic Research Unit and the UK Meteorological Office Hadley Centre. Global Annual Average data set TaveGL2v [1] was used. Documentation for the most recent update of the CRU/Hadley instrumental data set appears in: The original version of this figure was prepared by Robert A. Rohde from publicly available data and is incorporated into the Global Warming Art project. #Data from Moberg et al. was taken directly from the supplemental information accompanying the Nature article. #Data for Oerlemans was provided by William M. Connolley. #Esper et al. reported only fluctuations in "arbitrary" units, so the variance in this record was rescaled to match the variance during the period of overlap with the instrumental record. #When a paper included multiple reconstructions, the global annually average temperature data was used. If this was not reported, then Northern Hemisphere annually averaged data was used. #Four records appearing at [2] were not used in preparing this graph for the following reasons: ##Mann et al. 98 was not included because Mann et al. 99 extended and updated that record. ##Briffa et al. 98 was not included because Briffa et al. 2001 extended and updated that record. ##Pollack et al. 98 was not included because the reported data was not found to be in a form that allowed for easy replotting. ##Mann et al. 2000 was not used because it did not include an original reconstruction covering at least the Northern Hemisphere. |
| Datum | for 2004 how 2004 before 1000 before 1000 black 1856 |
| Zdroj | http://www.ngdc.noaa.gov/paleo/recons.html |
| Autor |

|
Tento obrázek (skupina graph) by měl být vytvořen pomocí vektorové grafiky jako SVG soubor. To má několik výhod; podrobnosti najdete na stránce Commons:Media for cleanup. Je-li SVG verze tohoto obrázku již k dispozici, prosím nahrajte ji. Po nahrání nahraďte tuto šablonu šablonou {{Vector version available|jméno nového obrázku.svg}}.
|
References
- The Holocene.
- Geophysical Research Letters.
- Ambio. Mo
- Science.
- J. Geophys. Res..
- Science.
- Geophysical Research Letters.
- doi:10.1029/2003GL017814.
- Reviews of Geophysics.
- doi:10.1029/2003RG000143
- Geophys. Res Lett..
- doi:10.1029/2004GL019781
- Nature.
- doi:10.1038/nature03265
- Science.
- doi:10.1126/science.1107046
- Journal of Climate.
Image from Global Warming Art
This image is an original work created for Global Warming Art. Please refer to the image description page for more information.

|
Tento dokument smí být kopírován, šířen nebo upravován podle podmínek Svobodné licence GNU pro dokumenty verze 1.2 nebo libovolné vyšší verze publikované nadací Free Software Foundation. Dokument nemá neměnné části ani texty na předním či zadním přebalu. Kopie textu licence je k dispozici v oddíle nazvaném GNU Free Documentation License. |
| Tento soubor podléhá licenci Creative Commons Uveďte autora-Zachovejte licenci 3.0 Unported | ||
| ||
| Tato licenční šablona byla k tomuto souboru přidána v rámci změny licencování. |
| Dragons flight's Temperature Record Series |
| This figure is part of a series of plots created by Dragons flight to illustrate changes in Earth's temperature and climate across many different time scales. |
| Time Period: 25 yrs | 150 yrs | 1 kyr | 2 kyr | 12 kyr | 450 kyr | 5 Myr | 65 Myr | 500 Myr |
| For articles related to this topic see: Temperature record |
Historie souboru
Kliknutím na datum a čas se zobrazí tehdejší verze souboru.
| Datum a čas | Náhled | Rozměry | Uživatel | Komentář | |
|---|---|---|---|---|---|
| současná | 9. 2. 2014, 13:11 | | 2 496 × 1 966 (179 KB) | Jirka Dl | User created page with UploadWizard |
Využití souboru
Tento soubor používají následující 2 stránky: