Soubor:Projected global primary electricity consumption by source, over the 21st century, for a climate change mitigation scenario.png

Původní soubor (1 508 × 850 pixelů, velikost souboru: 71 KB, MIME typ: image/png)
| Tento soubor pochází z Wikimedia Commons. Níže jsou zobrazeny informace, které obsahuje jeho tamější stránka s popisem souboru. |
Popis
| Popis |
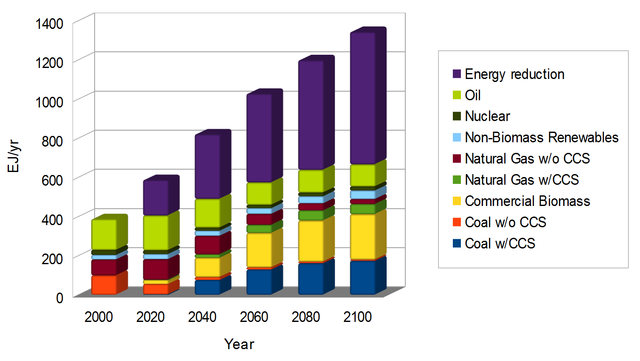
English: This graph shows a projection of global primary electricity consumption (PEC) by source, over the 21st century. It is based on a climate change mitigation scenario, in which anthropogenic (i.e., human) greenhouse gas emissions are substantially reduced over the century.
The graph shows how a variety of energy sources contribute to PEC. It also shows how energy consumption is reduced compared to a "reference scenario", in which no efforts are made to reduce greenhouse gas emissions. In the scenario, PEC increases over time, from 387 exajoules (EJ) in 2000, to 666 EJ in 2100. Energy savings contribute significantly to reductions in energy use compared to the reference scenario. In the reference scenario, PEC increases from 387 EJ in 2000 to 1344 EJ in 2100. The graph shows that fossil fuels dominate PEC in 2000. By 2060, most coal is used with carbon capture and storage (CCS), with a increase in the share of PEC supplied by commercial biomass. In 2100, the percentage contributions to PEC are: energy reductions 51; coal with CCS 13; coal without CCS 0.4; commercial biomass 17; natural gas with CCS 3.8; natural gas without CCS 1.9; non-biomass renewables 3.3; nuclear power 1.5; oil 8.4. Data Data for the mitigation scenario are summarized below. The full set of data are provided in a later section as comma-separated values (CSV). The data below summarizes PEC by source in EJ. Energy reductions in the mitigation scenario are equal to total PEC in the reference scenario minus total PEC in the mitigation scenario. Data are provided for the years 2000, 2050, and 2100, respectively:
The following data shows the percentage contribution of sources to total PEC. Data are provided for the years 2000, 2050, and 2100, respectively:
Data sources Scenario data are taken from Clarke et al. (2007)[1] The graph is based on the "IGSM_REF" reference and "IGSM_Level1" mitigation scenarios. Data from Clarke et al. (2007)[1] are in the public-domain, and are included in a following section. The report by Clarke et al. (2007)[2] includes a graph similar to this one.
References
|
| Datum | |
| Zdroj |
Vlastní dílo Tento grafika byl vytvořen programem LibreOffice Calc. |
| Autor | Enescot |
| Další verze | Greyscale version |
.png)
Comma-separated values
Data were exported from OpenOffice.org 4.0.0 Calc as comma separated values (csv). The following options were used:
- Character set: Western Europe 1252
- Field delimiter: ,
- Text delimiter: "
- Quote all text cells: no
- Save cell content as shown: yes
- Fixed column width: no
,2000,2020,2040,2060,2080,2100
Coal w/CCS,0,1.8726625295,75.444508718,129.1418011217,161.2538170578,173.6080558426
Coal w/o CCS,98.8551419634,52.5763595296,14.7533997718,10.6949287477,7.8754730012,5.8328272264
Commercial Biomass,0,20.6083814814,99.0391793264,176.0803406657,210.4123076545,232.6318594815
Natural Gas w/CCS,0,1.5101981599,17.1928804846,41.4536597029,51.1393522238,51.5289485318
Natural Gas w/o CCS,81.7896749777,105.2241810432,94.7490924601,55.8540853312,36.0936516819,24.8688375282
Non-Biomass Renewables,22.4833651954,25.7664179053,25.7110203361,29.253511178,36.4853378946,44.045134245
Nuclear,25.5985811645,19.5501420401,16.2462719057,16.8718264901,18.7264128277,20.4973853194
Oil,158.145950192,178.1305902789,146.8464751178,114.2820116004,115.9689587686,113.0792083141
Energy reduction,-0.000000048,181.9869034265,330.6765460279,454.2481828487,561.2932891661,677.6003453143
Licence
| Tento soubor byl uvolněn pomocí Creative Commons CC0 1.0 Universal Public Domain Dedication. | |
| Osoba, která toto dílo označila tímto dokumentem, dílo uvolnila do public domain tím, že se celosvětově vzdala všech autorských práv ke svému dílu včetně všech souvisejících a příbuzných zákonných práv, které k dílu má, v rozsahu umožněném zákonem. Můžete toto dílo rozmnožovat, upravovat, rozšiřovat či provozovat, i pro komerční účely, vše bez nutnosti žádat o svolení.
|
Historie souboru
Kliknutím na datum a čas se zobrazí tehdejší verze souboru.
| Datum a čas | Náhled | Rozměry | Uživatel | Komentář | |
|---|---|---|---|---|---|
| současná | 3. 11. 2013, 10:10 | | 1 508 × 850 (71 KB) | Enescot | {{Information |Description ={{en|1=This graph shows a projection of global primary electricity consumption (PEC) by source, over the 21st century. It is based on a [[:en:climate change mitigation|climate change mitiga... |
Využití souboru
Tento soubor používá následující stránka:
Globální využití souboru
Tento soubor využívají následující wiki:
- Využití na da.wikipedia.org