Soubor:Circle cos sin.gif

Circle_cos_sin.gif(650 × 390 pixelů, velikost souboru: 517 KB, MIME typ: image/gif, ve smyčce, 60 snímků, 6,0 s)

Popis

Popis
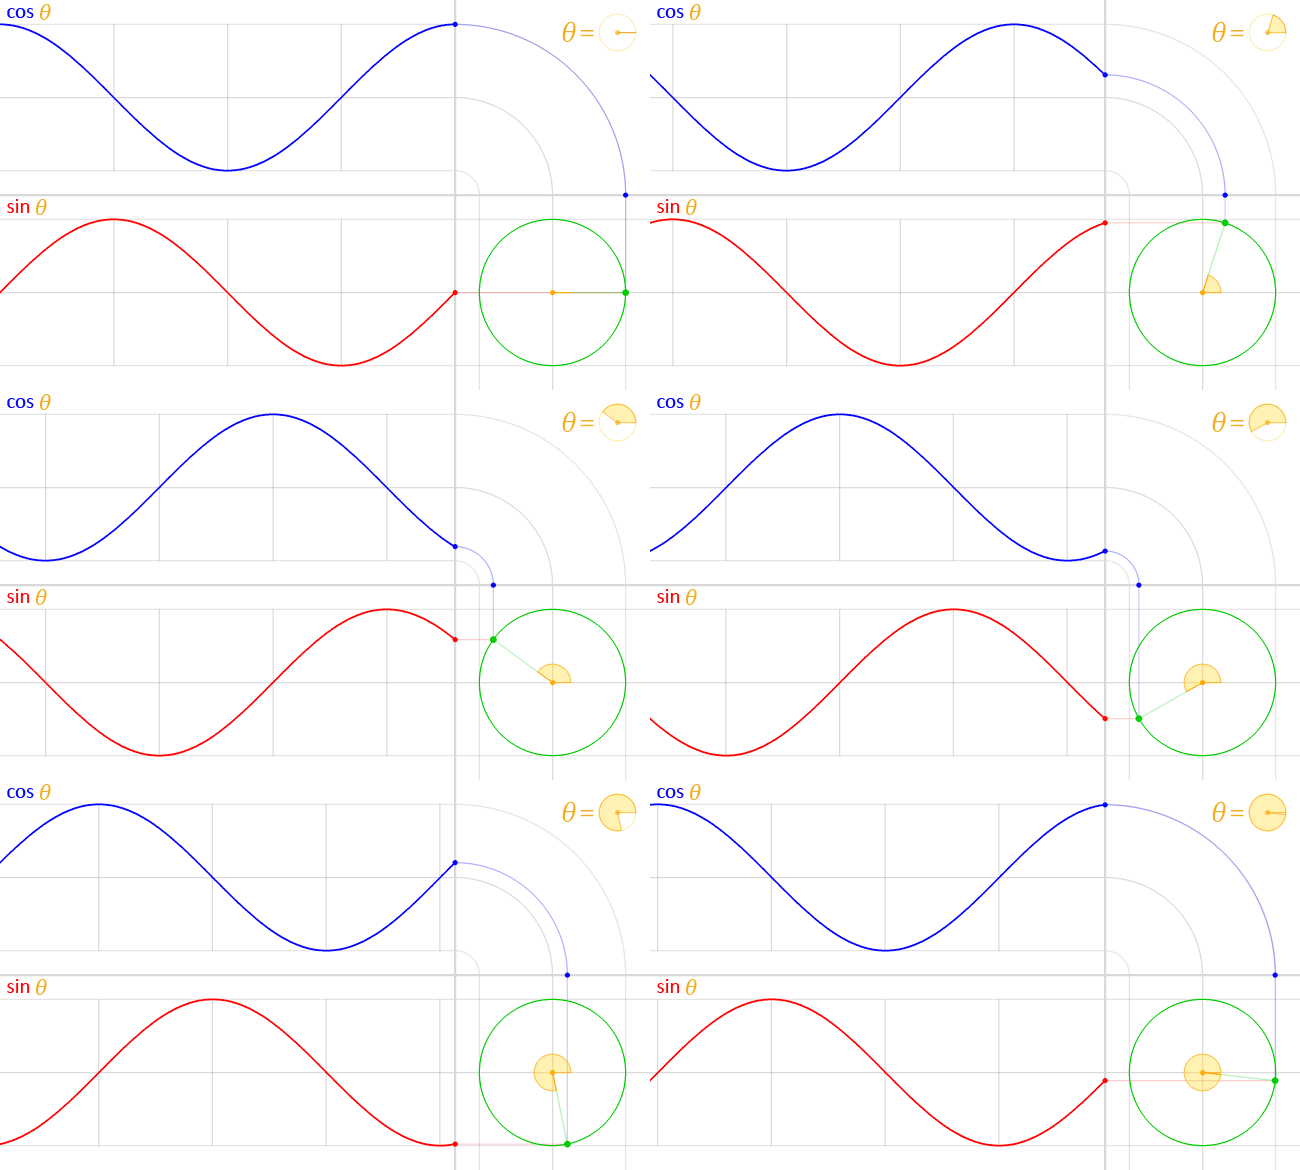
English: We have the unit circle (with radius = 1) in green, placed at the origin at the bottom right.

In the middle of this circle, in yellow, is represented the angle theta (θ). This angle is the amount of counter-clockwise rotation around the circle starting from the right, on the x-axis, as illustrated. An exact copy of this little angle is shown at the top right, as a visual illustration of the definition of θ.

At this angle, and starting at the origin, a (faint) green line is traced outwards, radially. This line intersects the unit circle at a single point, which is the green point spinning around at a constant rate as the angle θ changes, also at a constant rate.

The vertical position of this point is projected straight (along the faint red line) onto the graph on the left of the circle. This results in the red point. The y-coordinate of this red point (the same as the y-coordinate of the green point) is the value of the sine function evaluated at the angle θ, that is:

y coordinate of green point = sin θ

As the angle θ changes, the red point moves up and down, tracing the red graph. This is the graph for the sine function. The faint vertical lines seen passing to the left are marking every quadrant along the circle, that is, at every angle of 90° or π/2 radians. Notice how the sine curve goes from 1, to zero, to -1, then back to zero, at exactly these lines. This is reflecting the fact sin(0) = 0, sin(π/2) =1, sin(π) = 0 and sin(3π/ 2) -1

A similar process is done with the x-coordinate of the green point. However, since the x-coordinate is tilted from the usual convention to plot graphs (where y = f(x), with y vertical and x horizontal), an “untilt” operation was performed in order to repeat the process again in the same orientation, instead of vertically. This was represented by a “bend”, seen on the top right.

Again, the green point is projected upwards (along the faint blue line) and this “bent” projection ends up in the top graph’s rightmost edge, at the blue point. The y-coordinate of this blue point (which, due to the “bend” in the projection, is the same as the x-coordinate of the green point) is the value of the cosine function evaluated at the angle θ, that is:

x coordinate of green point = cos θ
The blue curve traced by this point, as it moves up and down with changing θ, is the the graph of the cosine function. Notice again how it behaves at it crosses every quadrant, reflecting the fact cos(0) = 1, cos(π/2) = 0, cos(π) = -1 and cos(3π/2) = 0.
Datum
Zdroj Vlastní dílo
Autor Lucas Vieira
Svolení
(Užití tohoto souboru)
Public domain Já, autor tohoto díla, jej tímto uvolňuji jako volné dílo, a to celosvětově.
V některých zemích to není podle zákona možné; v takovém případě:
Poskytuji komukoli právo užívat toto dílo za libovolným účelem, a to bezpodmínečně s výjimkou podmínek vyžadovaných zákonem.

Popisky

Přidejte jednořádkové vysvětlení, co tento soubor představuje

Položky vyobrazené v tomto souboru

zobrazuje

c06fd6a5f798c5ac8eb37784d218a2f190916f4d

529 197 bajt

5,999999999999995 sekunda

390 pixel

650 pixel

Historie souboru

Kliknutím na datum a čas se zobrazí tehdejší verze souboru.

Datum a časNáhledRozměryUživatelKomentář
současná24. 6. 2014, 02:32Náhled verze z 24. 6. 2014, 02:32650 × 390 (517 KB)LucasVBReverted to version as of 15:59, 16 March 2014
23. 6. 2014, 01:00Náhled verze z 23. 6. 2014, 01:00390 × 650 (390 KB)SteinsplitterBotBot: Image rotated by 90°
16. 3. 2014, 17:59Náhled verze z 16. 3. 2014, 17:59650 × 390 (517 KB)LucasVB{{Information |Description ={{en|1=sin & cos}} |Source ={{own}} |Author =LucasVB |Date =2014-03-16 |Permission ={{PD-self}} |other_versions = }} Category:Trigonometry [[Category:Trigonometric funct...

Tento soubor používají následující 2 stránky:

Globální využití souboru

Tento soubor využívají následující wiki: