Soubor:20210827 Global surface temperature bar chart - bars color-coded by El Niño and La Niña intensity.svg

Původní soubor (soubor SVG, nominální rozměr: 1 000 × 750 pixelů, velikost souboru: 9 KB)
| Tento soubor pochází z Wikimedia Commons. Níže jsou zobrazeny informace, které obsahuje jeho tamější stránka s popisem souboru. |
Popis
| Popis |
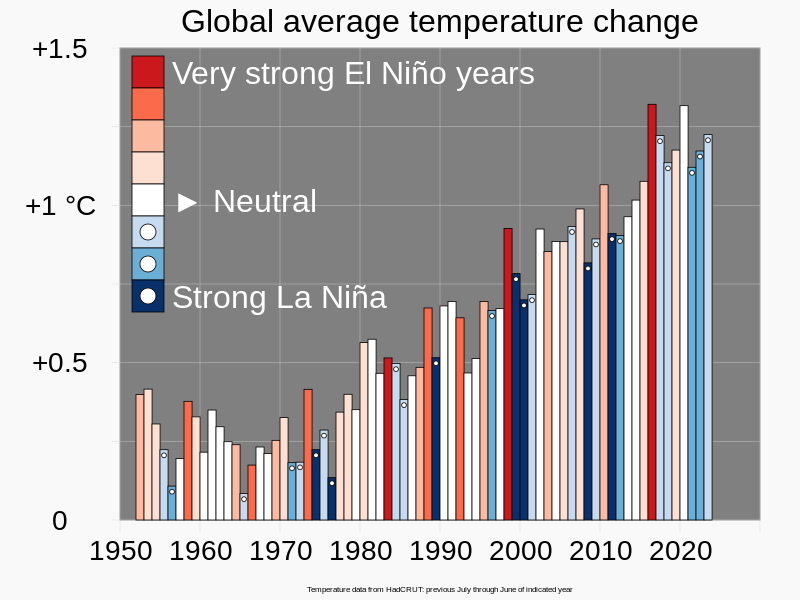
English: Bar chart of global surface temperature, with bars color-coded by El Niño and La Niña intensity.
Chart shows correlation of the (regional) El Niño–Southern Oscillation to global mean surface temperature. Suggested caption:
El Niño and La Niña intensity data is based on a year extending, roughly, from July of one year to June of the following year. Accordingly, I formed 12-month averages of global mean surface temperature anomalies from HadCRUT data extending from July to June, rather than the conventional calendar-year averaging. The height of each bar is determined by temperature change for that time period, and the color of the bar is determined by the El Niño and La Niña intensity category in that time period. The dark background, and black outlines of the individual bars, enable the colors to be seen more vividly. Circles were added to blue bars to help color-blind readers.
|
||
| Datum | |||
| Zdroj | Vlastní dílo | ||
| Autor | RCraig09 | ||
| Další verze |
Díla odvozená od tohoto souboru: |


Licence
- Dílo smíte:
- šířit – kopírovat, distribuovat a sdělovat veřejnosti
- upravovat – pozměňovat, doplňovat, využívat celé nebo částečně v jiných dílech
- Za těchto podmínek:
- uveďte autora – Máte povinnost uvést autorství, poskytnout odkaz na licenci a uvést, pokud jste provedli změny. Toho můžete docílit jakýmkoli rozumným způsobem, avšak ne způsobem naznačujícím, že by poskytovatel licence schvaloval nebo podporoval vás nebo vaše užití díla.
- zachovejte licenci – Pokud tento materiál jakkoliv upravíte, přepracujete nebo použijete ve svém díle, musíte své příspěvky šířit pod stejnou nebo slučitelnou licencí jako originál.
Historie souboru
Kliknutím na datum a čas se zobrazí tehdejší verze souboru.
| Datum a čas | Náhled | Rozměry | Uživatel | Komentář | |
|---|---|---|---|---|---|
| současná | 23. 7. 2023, 20:32 | | 1 000 × 750 (9 KB) | RCraig09 | Version 8: MAJOR CHANGES: Adjusted temperature data to be measured with respect to "Pre-industrial levels" (1850-1900). Retained Japanese and Korean language translations in <switch> specifications |
| 18. 5. 2023, 16:03 |  | 1 000 × 750 (11 KB) | TAKAHASHI Shuuji | File uploaded using svgtranslate tool (https://svgtranslate.toolforge.org/). Added translation for ja. | |
| 1. 4. 2023, 10:38 |  | 1 000 × 750 (10 KB) | Aspere | File uploaded using svgtranslate tool (https://svgtranslate.toolforge.org/). Added translation for ko. | |
| 30. 1. 2023, 22:00 |  | 1 000 × 750 (8 KB) | RCraig09 | Version 5: update to include data through June 2022 | |
| 27. 11. 2021, 22:45 |  | 1 000 × 750 (8 KB) | RCraig09 | Version 4: moving dots near ends of bars to make it easier to see different influence bars . . . making SVG coding a bit more compact | |
| 27. 11. 2021, 22:43 |  | 1 000 × 750 (8 KB) | RCraig09 | Version 3: adding dots to La Nina bars for accessibility for color-blind people | |
| 28. 8. 2021, 07:32 |  | 1 000 × 750 (7 KB) | RCraig09 | Version 2: Clarify that HadCRUT provided temperature data only | |
| 28. 8. 2021, 04:02 |  | 1 000 × 750 (7 KB) | RCraig09 | Uploaded own work with UploadWizard |
Využití souboru
Tento soubor používá následující stránka:
Globální využití souboru
Tento soubor využívají následující wiki:
- Využití na en.wikipedia.org
- Využití na en.wikiversity.org
- Využití na fa.wikipedia.org
- Využití na ja.wikipedia.org
- Využití na ko.wikipedia.org
- Využití na mk.wikipedia.org
- Využití na ru.wikipedia.org